The Effect of ElevATPÃÆâÃâââ¬Å¾Ãââ on Exercise Output: A Single Dose, Blinded, Three-Way Cross-Over Study
Tania Reyes-Izquierdo, Boris Nemzer, Ruby Argumedo, Melissa Cervantes and Zbigniew Pietrzkowski
Tania Reyes-Izquierdo1*, Boris Nemzer2, Ruby Argumedo1, Melissa Cervantes1 and Zbigniew Pietrzkowski1
1Futureceuticals, Laguna Canyon Rd, Suite 150, Irvine, CA, USA
2Futureceuticals, N. State Rt. 1-17, Momence, IL, USA
- *Corresponding Author:
- Tania Reyes-Izquierdo Futureceuticals
16259 Laguna Canyon Rd, Suite 150, Irvine, CA, USA
Tel: +1 949502 4496
Fax +1 949 5024987
E-mail: treyes@futureceuticals.com
Received date: June 10, 2016; Accepted date: August 29, 2016; Published date: August 31, 2016
Citation: Izquierdo TR, Nemzer B, Argumedo R, et al. The Effect of Elevatp™ on Exercise Output: A Single Dose, Blinded, Three-Way Cross-Over Study. 2016, 1:2.
Abstract
Background: Adenosine 5’-triphosphate (ATP) serves as a cellular source of energy for metabolic processes. Maintaining high levels of intracellular ATP has the potential to enhance performance. ElevATP™, a proprietary blend of ancient peat and apple extract, has twice been reported to increase intracellular blood levels of ATP in resting subjects after a single dose per os. More recently, resistance-trained males supplemented with ElevATP™ for 12 weeks, have shown increased resistancetraining- induced skeletal muscle hypertrophy. For this pilot study, we determined the acute effects of a single dose of ElevATP™ on the exercise output of subjects with sedentary lifestyles. Methods and findings: Nine healthy subjects were evaluated before, during, and after 20 minute duration stepping exercise in a blinded three-way crossover study of placebo and a single dose of ElevATP™. Two lots of ElevATP™ (Lot A and Lot B) were each compared to placebo in all subjects. Four (4) female and five (5) male subjects that did not regularly exercise were evaluated. Mean subject age was 27.3 ± 5.0 years and BMI was 28.97 ± 6.6 kg/m². ElevATP™ supplemented subjects (Lot A and Lot B) took a significantly greater number of steps and burned more calories than when treated with placebo. Post-exercise analysis has shown no significant changes in blood lactate or glucose levels between ElevATP™ (Lota A or Lot B) and placebo treatments. Conclusion: All nine subjects experienced an increase in exercise performance after ingesting a single dose of either of the two tested lots of ElevATP™, compared to a placebo control.
Keywords
ATP; Micronutrients; Cross-over study; Exercise endurance
Introduction
Skeletal muscle is dependent on blood flow and oxygen availability for best function [1]. During exercise the cardiovascular system responds to skeletal muscle cellular demands by increasing oxygen and nutrient delivery to the muscle. Skeletal muscle cells use these nutrients to produce adenosine triphosphate (ATP), the final energy source for muscle contraction. There is a decrease in intracellular ATP levels during the process of aging. The ability to generate ATP is diminished as well, negatively impacting skeletal muscle work output capabilities [2,3]. Maintenance of higher level of ATP production in vivo is thought to correlate with better overall health and athletic performance [4].
Basic and clinical research has focused on ATP supplementation as a means to promote healthy muscle energy metabolism and healthy aging in humans. Administration of oral ATP to athletes has been shown to increase total bench press lifting volume [5], reduce muscle fatigue and increase force output during repeated highintensity exercises [6] and significantly increase lean body mass, muscle thickness, total muscle strength and vertical jump power [7]. The mechanism of action of orally ingested ATP is not known, as it does not raise blood levels of ATP. It has been hypothesized to contribute to the formation of ATP degradation products which are taken up by erythrocytes and reconstituted into ATP [8].
ElevATPTM is a blend of plant bio-inorganic trace minerals and a polyphenol-rich apple extract [4]. A single oral dose of ElevATP™ has been shown to increase whole blood ATP levels as well as muscle levels of ATP in healthy resting subjects [4,9]. It was also reported that once daily dosing with ElevATP™ for twelve weeks resulted in improved resistance training-induced skeletal muscle hypertrophy without affecting fat mass or blood chemistry [9]. This current pilot study was performed on sedentary young healthy subjects taking a single dose of ElevATP prior to 20 minutes’-long step exercise. In a three way cross-over pilot study, we evaluate the effects of two lots of ElevATP™ on the exercise capability of healthy non-athlete subjects, compared to placebo.
Materials and Methods
Clinical study
This double blind, placebo controlled, three-way crossover clinical case study was conducted according to guidelines laid out in the Declaration of Helsinki. All procedures involving human subjects were approved by the Ethics Committee named Comité de Investigación Biomédica para el Desarrollo de Fármacos S.A de C.V, (Zapopan JAL, Mexico) (FC-2015- ElevATP). Sixteen subjects were recruited to participate. Subjects were fit enough to exercise but mostly lived sedentary life styles. Subjects reportedly participated in less than 20 min of structured exercise per week. Exercise levels were classified as minimal (no exercise or sedentary), light (occasional dog walks, strolls through the park, or walking around school), moderate (occasional swimming, brief running, yoga, or spin class for less than 2 days a week), or vigorous (frequent working out, physical training, or hiking). No participant engaged in vigorous exercise.
Subjects had no food allergies, rhinitis, influenza, or other acute infections. Six subjects were excluded from the study for lack of compliance. Exclusion criteria included diagnosis of diabetes mellitus, allergies to dietary products, use of antiinflammatory drugs, analgesics, statins, diabetic drugs, antiallergy medications, multivitamins, history of strenuous exercise and use of supplements within 15 days of the start of the study. Normal participant BMI was defined as 18.5 to 24.9 kg/m2 and obese as greater than 30 kg/m2. All participants gave written, informed consent before any experimental procedure was performed.
Blood collection
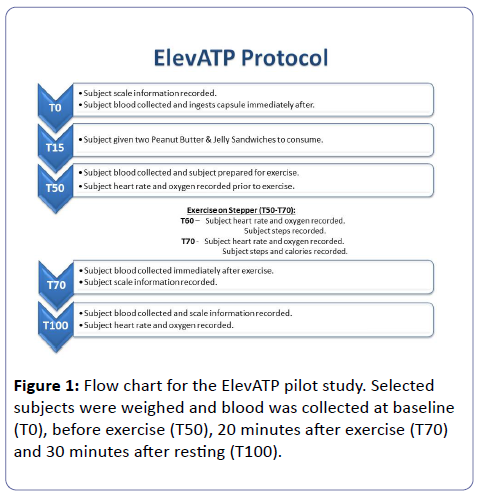
Enrolled participants were instructed to fast for 12h prior to the initial blood draw. Blood samples were collected prior to receiving supplements. A total of 400 μL of blood was collected by finger puncture and placed in Safe-T-Fill® capillary lithium heparin blood collection tubes (Ram Scientific Inc. Yonkers, NY). 40 μL of blood was snap frozen immediately after collection for ATP assays. The remaining blood was used for gas analysis or processed to obtain plasma. Samples were collected at each of four time points: immediately prior to (T0 or baseline) and at 50, 70 and 100 minutes after test capsule administration (Figure 1).
Exercise protocol
Subjects fasted for 12 h prior to each of the three exercise study days. Two lots of ElevATP™ were provided by FutureCeuticals, Inc., Momence, IL USA. Separate testing was performed with each lot so that each subject was tested using placebo (P), ElevATP™ (Lot A), and ElevATP™ (Lot B) on 3 separate days (Day 1 [D1], Day 2 [D2], and Day 3 [D3]). A 10 day recovery period occurred between D1 and D2 and between D2 and D3. On D1 of the study, subjects were randomly given capsules (Capsuline®, Pompano Beach, FL, USA) containing 150 mg of ElevATP ™ (Lot A), ElevATP™ (Lot B), or an empty capsule as placebo. Participants were also given 350 ml of water and advised to save a portion to drink with the snacks provided as part of the study. No additional water was administered during the 100 min study period on each of the 3 exercise study days. Subjects were given two Smucker’s Uncrustables® sandwiches (JM Smucker Co, Orrville, OH, USA) on each day to ingest 15 minutes after taking a capsule. This meal was administered to prevent hypoglycemia during exercise. Each standardized snack contained 210 kcal with 28 g of total carbohydrates, 9 g of fat and 6 g of protein (For a total of 420 kcal, 56 g total carbohydrates, 18g of fat and 12 g of protein). Blood was collected via finger stick before ingestion of capsule (T0) and, 35 min after the consumption of snacks (T50). Afterwards, subjects were prompted to exercise. Furthermore, finger blood was collected after completion of 20 minute exercise (T70) and after 30 minutes of rest following exercise (T100). On D2 of the study, subjects were randomized to receive one of the remaining two test capsules. On D3 study subjects received the remaining supplementation test capsule. Subjects and staff were blinded to the content of the capsules. Participants remained at rest prior to and after exercise. Exercise consisted of steppers obtained from Sunny Health & Fitness Mini Stepper with Resistance Bands (City of Industry, California, USA). The steppers were set to medium resistance and subjects were encouraged to exercise at maximum capacity for 20 min. Subjects were advised to take full steps during exercise. The number of steps completed and total calories burned were recorded by the ministepper. Blood oxygen saturation and heart rate were recorded just before exercise (T50) and also at 10 and 20 minutes during the 20 min exercise period (T60 and T70) (Figure 1). Blood oxygen saturation was measured using a portable finger pulse oximeter OX SpO2 fingertip oxygen digital monitor (Beijing Choice Electronic Co. Beijing, China). Blood was collected for analysis immediately after exercise (T70). Subjects were weighed and body water was recorded at baseline (T0) and immediately after exercise (T70). Weight and body water content were determined using a Weight Watchers® glass body analysis scale model WW52Y by Conair (East Windsor, New Jersey, USA) which measures the hydration level by using bioelectric impedance analysis (BIA). The subjects’ height, age, and gender were entered into the scale as parameters prior to measuring each subject [10]. Blood oxygen saturation, heart rate, body weight, and body water determinations and blood testing were measured once again at 30 min post-exercise (T100).
Blood glucose and lactate measurements
Glucose tests were performed on fresh blood using an Accu- Chek® Compact Plus glucometer and Accu-Chek® test strips (Roche Diagnostics, Indianapolis, IN, USA) and lactate was measured using an Accutrend® Lactate Point of Care meter (EKF Diagnostics, Leipzig, Germany), respectively.
Chemical composition
Each lot of ElevATP™ was subjected to mineral analysis (Table 1).
| ElevATPTM Lot A | ElevATPTM Lot B | ElevATPTM Lot A | ElevATPTM Lot B | ||
|---|---|---|---|---|---|
| Mineral | Concentration (µg/g ElevATPTM) | Mineral | Concentration (µg/g ElevATPTM) | ||
| Aluminum | 16,980. | 15,100. | Molybdenum | <0.5 | <0.5 |
| Antimony | <0.5 | <0.5 | Neodymium | 5.74 | 6.31 |
| Arsenic | 0.341 | 0.564 | Nickel | 25.7 | 215. |
| Barium | <0.5 | <0.5 | Niobium | <0.5 | <0.5 |
| Beryllium | 5.57 | 1.72 | Osmium | 0.001 | <0.001 |
| Bismuth | <0.5 | <0.5 | Palladium | 0.934 | 1.82 |
| Boron | 30.2 | 45.0 | Phosphorus | 38.3 | 46.2 |
| Cadmium | 2.37 | 7.08 | Potassium | 801 | 1,083. |
| Calcium | 10,980. | 12,270. | Praseodymium | 1.433 | 0.956 |
| Cerium | 10.99 | 4.97 | Rhenium | 0.005 | 0.022 |
| Cesium | 0.097 | 0.063 | Rhodium | 0.005 | 0.006 |
| Chromium | <0.5 | <0.5 | Rubidium | 1.627 | 2.243 |
| Cobalt | 40.1 | 58.9 | Ruthenium | <0.001 | <0.001 |
| Copper | 1.085 | 1.88 | Samarium | 1.157 | 3.080 |
| Dysprosium | 1.73 | 5.48 | Scandium | 0.643 | 0.618 |
| Erbium | 1.034 | 2.58 | Selenium | 2.823 | 5.641 |
| Europium | 0.269 | 0.942 | Silicon | 1,099. | 1,048. |
| Gadolinium | 1.543 | 4.84 | Silver | <0.5 | <0.5 |
| Gallium | 0.043 | 0.037 | Sodium | 8,189. | 36,820. |
| Germanium | <0.001 | <0.001 | Strontium | 97.1 | 119. |
| Gold | <0.5 | <0.5 | Sulfur | 144,400. | 174,800. |
| Hafnium | 0.054 | 0.053 | Tantalum | 0.005 | 0.014 |
| Holmium | 0.363 | 1.060 | Terbium | 0.285 | 0.948 |
| Iodine | 0.52 | 0.54 | Thorium | 14.4 | 14.4 |
| Iron | 47.6 | 118. | Thulium | 0.130 | 0.282 |
| Lanthanum | 5.08 | <0.5 | Tin | 0.159 | 0.029 |
| Lead | 0.1 | 0.086 | Tungsten | <0.5 | <0.5 |
| Lithium | 238. | 594. | Ytterbium | 0.762 | 1.49 |
| Lutetium | 0.098 | 0.08 | Yttrium | 68.8 | 175. |
| Magnesium | 73,240. | 113,400. | Zinc | 309. | 294. |
| Manganese | 350. | 1,110. | Zirconium | 11.0 | 10.5 |
| Mercury | 0.018 | <0.001 | |||
Table 1: Mineral analysis of ElevATPTM lots A and B.
Apple extract was subjected to polyphenol analysis (Table 2) prior to mixing with each lot of ElevATP™.
| Bioactive compounds in apple extract | |
|---|---|
| Analytes | Concentration (ug/1 g ElevATPTM) |
| 5-O-caffeoylquinic acid | 10.8 |
| Procyanidin dimers | 11.1 |
| Procyanidin trimers | 1.5 |
| Procyanidin tetramers | 0.3 |
| Catechin | 1.4 |
| Epicatechin | 3.9 |
| 4-O-p Coumaric acid | 1.2 |
| Phloretin xyloglucoside | 2.1 |
| Phloretin glucoside | 4.2 |
| Quercetin | 0.1 |
| Phloretin | 0.7 |
| Quinic acid | 0.2 |
| Malic acid | 0.3 |
Table 2: Polyphenol analysis of apple extract.
Mineral analysis
A 1.2 gm sample test portion of ElevATP™ was dry-ashed at 500 °C ± 50 0C for 8 hours and treated with nitric acid. The resultant ash was treated with concentrated hydrochloric acid, dried, and re-dissolved in hydrochloric acid solution (5%) [11]. The amount of each element was determined by comparing the emission of the sample against the emission of each element from standard solutions using Inductively Coupled Plasma Atomic Emission Spectroscopy (ICAP-61E-Trace, Thermo Jarrell-Ash) [12] or by mass spectrometry (United States pharmacopeia Chapter 730: USP <730>)[13]. All standard solutions used were obtained from Inorganic Ventures (Christiansburg, VA, USA) and were of analyticalreagent grade. The relative standard deviation (RSD) for analysis of each element was 4.8%. Data was presented as μg of mineral per gm of ElevATP™ tested.
Polyphenols analysis
Polyphenol analysis of the apple extract was carried out using a ThermoSurveyor HPLC system with an autosampler and sampler cooler maintained at 6 °C and a photodiode array detector scanning from 200-600 nm. 5 or 10 μL samples were injected onto a 250 x 4.6 mm C18 RP Polar Column (Phenomenex, Torrance, CA, USA) maintained at 40°C and eluted with a 5-40% gradient of 0.1% formic acid and acetonitrile at 1 mL/min over 45 minutes. The eluted sample passed serially through an absorbance detector and then a fluorescence detector (Jasco, Japan; excitation λ 290 nm, emission λ 320 nm). Twenty percent of the sample was diverted to the electrospray interface of the mass spectrometer. All samples were run in negative ion mode using data-dependent MS-MS for compound identification. The scan range was from 150-1500 amp.
Apple extract was analyzed using an UHPLC system (Thermo Scientific, Waltham, MA, USA) with an Orbitrap Exactive mass spectrometer. 5 or 10 μL samples were injected onto a 250 x 2.0 mm C18 RP Polar Column (Phenomenex, Torrance, CA, USA) maintained at 40°C and eluted with a 5-40% gradient of 0.1% formic acid and acetonitrile at 200 μL/min over 45 minutes. Identifications were based on authentic standards, where available, and from comparison of exact mass or MS-MS spectra with previously published data [14]. Quantification with authentic standards was carried out using both absorbance and fluorescence data. Quantification of catechins and procyanindins in the UHPLC system was carried out using the mass spectrometer.
Statistical analysis
Statistical analysis was performed using GraphPad® statistical software (Graphpad Software Inc., La Jolla, CA, USA). Descriptive statistics were presented as the mean ± standard deviation (SD). Results from supplemented groups were compared to placebo using a one-way analysis of variance (ANOVA) and Tukey’s post hoc analysis when a significant Fratio was observed. P-values less than 0.05 were considered statistically significant.
Results
Nine subjects were evaluated in this double blind, placebo controlled; three-way crossover clinical case study. Four female and 5 male subjects completed the protocol. The nine subjects’ mean age was 27.2 ± 5.5 years and their BMI was 28.3 ± 6.98 kg/m², (Table 3A).
| Age (mean ± SD) [years] |
Weight (mean ± SD) (pounds) |
Height (mean ± SD) (ft) | BMI (mean ± SD) [kg/m2] |
BMI Normal/ Obese |
|---|---|---|---|---|
| 27.22 ± 5.5 | 196.06 ± 65.05 | 5.7 ± 0.4 | 28.34 ± 6.98 | 5/4 |
Table 3A: Baseline demographic characteristics of the study (BMI: Body Mass Index; SD: Standard Deviation).
Baseline demographic characteristics of the study subjects all included subjects were clinically healthy and there were no significant demographic differences between groups. Subjects did not receive or take any nutritional supplements or other products during the study, per study instructions and participant report.
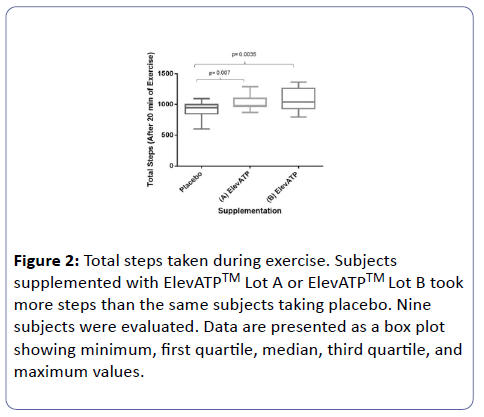
Total steps and calories burned were recorded by the stepper. Subjects supplemented with either lot of ElevATP™ took a significantly greater number of steps than the same subject treated with placebo (Lot A: 1029.3 ± 122.78 steps vs placebo: 910 ± 141 steps, P=0.007 and Lot B: 1,079.2 ± 189.26 steps vs. placebo: 910 ± 141 steps, P=0.003) (Figure 2).
Figure 2: Total steps taken during exercise. Subjects supplemented with ElevATPTM Lot A or ElevATPTM Lot B took more steps than the same subjects taking placebo. Nine subjects were evaluated. Data are presented as a box plot showing minimum, first quartile, median, third quartile, and maximum values.
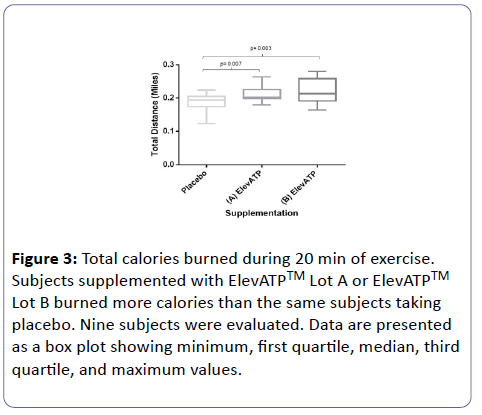
ElevATP™ supplemented subjects burned more calories than subjects treated with placebo (Lot A: 148 ± 18.8 calories vs placebo: 130 ± 20 calories, P=0.008 and Lot B: 154 ± 27 calories vs. placebo: 130 ± 20 calories, p = P.004) (Figure 3).
Figure 3: Total calories burned during 20 min of exercise. Subjects supplemented with ElevATPTM Lot A or ElevATPTM Lot B burned more calories than the same subjects taking placebo. Nine subjects were evaluated. Data are presented as a box plot showing minimum, first quartile, median, third quartile, and maximum values.
Blood oxygen saturation and heart rate were recorded prior to exercise (T50) and after exercise (T70) (Table 3B).
| PR bpm | spO2 (%) | |||||
|---|---|---|---|---|---|---|
| Time Points | Placebo (mean ± SD) |
ElevATPTM Lot A (mean ± SD) | ElevATPTM Lot B (mean ± SD) |
Placebo (mean ± SD) |
ElevATPTM Lot A (mean ± SD) | ElevATPTM Lot B (mean ± SD) |
| T60 | 81.56 ± 9.44 | 77.6 ± 12.32 | 79 ± 11.80 | 96.78 ± 2.86 | 97.89 ± 1.36 | 96.56 ± 2.60 |
| T70 | 143.22 ± 16.21 | 142.44 ± 22.27 | 146.56 ± 18.3 | 98.22 ± 0.67 | 98.33 ± 0.5 | 98.33 ± 0.5 |
| T100 | 97.22 ± 10.97 | 95.22 ± 12.41 | 93.89 ± 13.95 | 97.89 ± 0.60 | 98.11 ± 0.93 | 97.67 ± 1 |
| SD: Standard Deviation. PR bmp: Pulse rate beats per minute. spO2: peripheral capillary oxygen saturation (Normal spO2 values vary from 95 to 100%) T0E: Baseline; T60: time during exercise, T70: right after exercise, T100E 30 minutes after exercise. No difference was seen between placebo and either ElevATPTM Lot at any time point. | ||||||
Table 3B: Average heart rate and oxygen saturation before and after exercise.
There was no significant difference in the blood oxygen saturation or heart rate of the groups (placebo vs ElevATP™ [Lot A] and placebo vs. ElevATP™ [Lot B]) at these two time points.
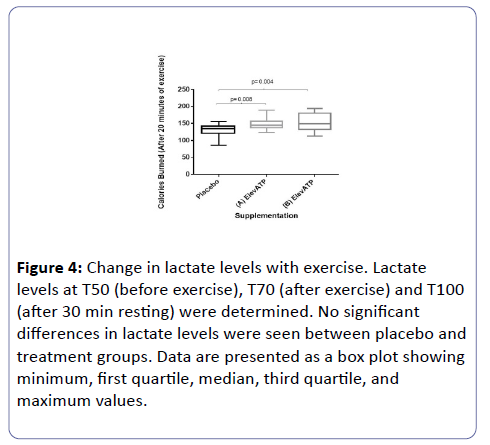
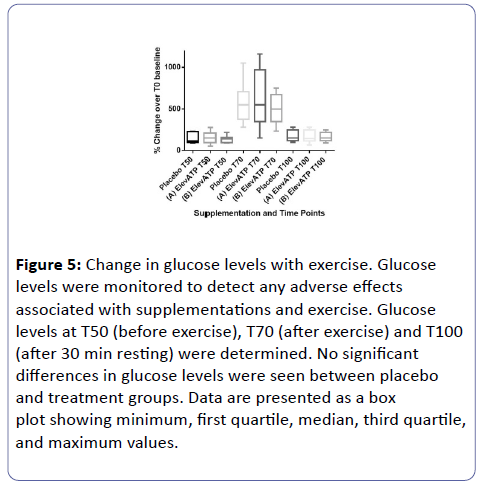
Blood lactate and glucose levels were determined at T0, T50, T70, and T100. Data was reported as the percent change from baseline (T0). No significant changes in blood lactate (Figure 4).
Figure 4: Change in lactate levels with exercise. Lactate levels at T50 (before exercise), T70 (after exercise) and T100 (after 30 min resting) were determined. No significant differences in lactate levels were seen between placebo and treatment groups. Data are presented as a box plot showing minimum, first quartile, median, third quartile, and maximum values.
Glucose levels (Figure 5) were observed (placebo vs. ElevATP™ [Lot A] and placebo vs. ElevATP™ [Lot B]) at any of the time points examined.
Figure 5: Change in glucose levels with exercise. Glucose levels were monitored to detect any adverse effects associated with supplementations and exercise. Glucose levels at T50 (before exercise), T70 (after exercise) and T100 (after 30 min resting) were determined. No significant differences in glucose levels were seen between placebo and treatment groups. Data are presented as a box plot showing minimum, first quartile, median, third quartile, and maximum values.
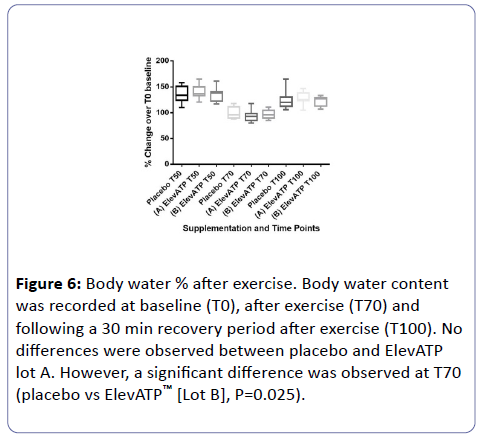
Body water percent (%) was recorded at baseline (T0), after exercise (T70), and after the recovery period (T100) (Figure 6).
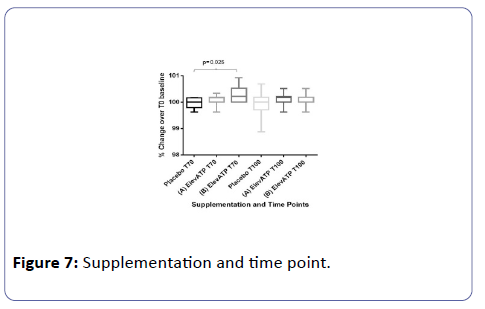
Figure 6: Body water % after exercise. Body water content was recorded at baseline (T0), after exercise (T70) and following a 30 min recovery period after exercise (T100). No differences were observed between placebo and ElevATP lot A. However, a significant difference was observed at T70 (placebo vs ElevATP™ [Lot B], P=0.025).
When compared to placebo, there was no significant difference in body water % in the ElevATP™ [Lot A] supplemented group either at T70 (P=0.13) or T100 (P=0.17). There were significant differences in the body water % of ElevATP™ [Lot B] supplemented group when compared to placebo at T70 (P=0.025). However, this difference was not observed 30 minutes later, at T100 (P=0.19).
The mineral content of ElevATP™ was evaluated (Table 1). From trace amounts (osmium, rhenium, rhodium, and tantalum) to mg amounts (aluminum, calcium, cerium, magnesium, manganese, nickel, phosphorus, potassium, sodium, strontium, sulfur, thorium, yttrium, zinc, and zirconium) of minerals were observed in each lot of ElevATP™. All mineral content was below that recommended by the FDA for daily consumption. A single lot of apple extract was used to prepare ElevATP™ (Lot A) and ElevATP™ (Lot B), so only a single analysis is presented (Table 2). A number of bioactive polyphenols were detected (Figure 7).
Discussion
Oral intake of a single dose of ElevATP™ has been shown to increase whole blood levels of ATP in human subjects without affecting reactive oxygen species or blood glucose and lactate levels [4,15]. Ingestion of single doses of ElevATPTM has also been associated with increased whole blood and muscle levels of ATP [4,15]. In this study, subjects who did not exercise regularly were evaluated and they took more steps, traveled further, and burned more calories after ingesting a single dose of either lot of ElevATP™, than after taking a placebo control. Blood lactate levels did not change significantly over the course of the study with either placebo or supplement, suggesting subjects exercised using aerobic metabolism. Subjects experienced similar heart rates and blood oxygen saturation after taking ElevATP™ and placebo control, suggesting muscle output was more efficient with ElevATP™, and not related to greater effort.
Exercise is associated with hydrolysis of ATP, lactate production, cellular heat generation leading to sodium loss and loss of cellular water, and local ischemia [16]. This energy depletion model has been used to describe the loss of cellular water to dissipate heat as ATP is generated [16]. In this model, greater availability of ATP would be associated with less water loss. Maintenance of total body water is an important part of fluid balance and is essential in maintaining cellular homeostasis. Best maintenance of body water % was observed with ElevATP™ (Lot B), although results were not consistent. No differences were seen between treatment and placebo by the end of the resting period, suggesting there was similar final recovery total body water. The small differences in the mineral composition of ElevATP™ (Lot A) and ElevATP™ (Lot B) did not appear to be significant enough to effect any differences in findings observed.
Obese subjects more frequently have a lower level of physical activity and impaired cardiorespiratory fitness and muscle strength than similar lean subjects [17-19]. The BMI of subjects we evaluated ranged from normal to moderately obese, with the mean value in the overweight range [17]. These subjects saw significant benefits in exercise capability after ingesting ElevATP™. The mineral composition of the two tested ElevATP™ lots was very similar. Plant polyphenols have been shown to have antioxidant activity and to increase exercise capacity in animal models [19-21]. A number of these compounds were identified in ElevATP™. Since the components found ElevATP are of natural origin, we can categorize them as nutraceuticals; which by definition are food or food components that have physiological benefits or provide protection against chronic diseases [22,23]. Nutraceuticals have received considerable interest due to their nutritional potential, safety and health beneficial effects. Several published studies have shown promising results for these compounds in various pathological complications such as diabetes, cancer, atherosclerosis, cardiovascular diseases and obesity [24]. To evaluate the potency of a nutraceutical, it is crucial that the claimed function has not only been proven in vitro or ex vivo; but also in vivo, since nutraceutical products are not monitored with the same level of scrutiny than pharmaceutical drugs [25]. However, they might affect the process of specific health conditions, their development and/or progress. A good example of an evaluation of several nutraceuticals is the review by Scicchitano et al. [26] on dyslipidemia, a main cardiovascular risk factor for coronary heart disease. In this analysis; several nutraceutical products claim to improve dyslipidemia conditions, but only one percent (1%) of the clinical studies performed show statistically significant efficacy. It is important to provide data in properly designed randomized clinical trials; clarify if a clinical study is a discovery/pilot study or an efficacy study and in both cases, provide data substantiating follow up claims. Limitations of the pilot study reported herein include the small numbers of subjects tested, broad range of BMI and the lack of measurements for parameters used in sport studies such as VO max and blood markers of muscle damage or inflammation. This pilot study was designed and performed in order to verify whether single a single dose of ElevATP™ may increase performance in sedentary young subjects.
Conclusion
Healthy non-athletic subjects that did not exercise regularly experienced a significant increase in exercise performance as well as an increased caloric burn upon supplementation of a single dose of ElevATP when compared to placebo. However, no significant differences were observed in blood glucose and lactate when compared to placebo. The mechanism of increased performance and caloric burn is currently under investigation. Since the BMI of the subjects participating in this study placed them in the “overweight/mildly obese” category, further investigation is required to verify the benefits of shortterm exercise by overweight and moderately obese subjects when supplemented with ElevATP. Lastly, the benefits seen in the young sedentary study participants, who are not likely experiencing a decline in ATP metabolism commonly associated with aging, is encouraging. Further studies are needed on aging subjects to determine the impact of ElevATP™ on their exercise capabilities and on exercise-induced health benefits.
Funding
The present study was funded by Futureceuticals, Inc. The sponsors had no role in the design and conduct of the study; in the collection, analysis, and interpretation of data.
Conflict of Interest Disclosure
All authors declare that they have no conflict of interest.
Acknowledgments
We express our gratitude to John Hunter (FutureCeuticals, Inc.) for his comments and suggestions in the preparation of this paper. We would also like to thank Michael Sapko for his help in editing and reviewing this manuscript.
References
- Kirby B, Crecelius A, Voyles W, Dinenno F (2012) Impaired skeletal muscle blood flow control with advancing age in humans: Attenuated ATP release and local vasodilation during erythrocyte deoxygenation. Circulation Research 111: 220-230.
- Miyoshi N, Oubrahim H, Chock PB, Stadtman ER (2006) Age-dependent cell death and the role of ATP in hydrogen peroxide-induced apoptosis and necrosis. Proc Natl Acad Sci USA 103: 1727-1731.
- Subasinghe W, Spence DM (2008) Simultaneous determination of cell aging and ATP release from erythrocytes and its implications in type 2 diabetes. Analytica Chimica Acta 618: 227-233.
- Reyes-Izquierdo T, Nemzer B, Argumedo R, Shu C, Huynh L, et al. (2013) Effect of the dietary supplement ElevATP on blood ATP Level: An acute pilot clinical study. J Aging Res Clin Practice 2: 178-184.
- Jordan AN, Jurca R, Abraham EH, Salikhova A, Mann JK, et al. (2004) Effects of oral ATP supplementation on anaerobic power and muscular strength. Med Sci Sports Exerc 36: 983-990.
- Rathmacher JA, Fuller JC, Jr., Baier SM, Abumrad NN, Angus HF, et al. (2012) Adenosine-5'-triphosphate (ATP) supplementation improves low peak muscle torque and torque fatigue during repeated high intensity exercise sets. J Int Soc Sports Nutr 9: 48.
- Sprague RS, Bowles EA, Achilleus D, Ellsworth ML (2011) Erythrocytes as controllers of perfusion distribution in the microvasculature of skeletal muscle. Acta physiologica (Oxford, England) 202: 285-292.
- Jager R, Roberts MD, Lowery RP, Joy JM, Cruthirds CL, et al. (2014) Oral adenosine-5'-triphosphate (ATP) administration increases blood flow following exercise in animals and humans. J Int Soc Sports Nutr 11: 28.
- Joy JM, Falcone PH, Vogel RM, Mosman MM, Kim MP, et al. (2015) Supplementation with a proprietary blend of ancient peat and apple extract may improve body composition without affecting hematology in resistance-trained men. Applied Physiology, Nutrition, and Metabolism 40: 1171-1177.
- Kushner RF, Schoeller DA (1986) Estimation of total body water by bioelectrical impedance analysis. Am J Clin Nutr 44: 417-424.
- AOAC (2005) Official method 923.03–Ash of flour, In: Official methods of analysis of AOAC International, AOAC International (18thedn), Gaithersburg, MD, USA.
- Herman RA (2005) Official method 985.01 – Metals, other elements in plants, pet foods. Official methods of analysis of AOAC International, (18thedn), Gaithersburg, MD, USA.
- Pharmacopeia US (2014) Guidelines on plasma spectrochemistry: Second supplement to USP 37–NF32, in general chapter <730>: USA.
- Marks SC, Mullen W, Crozier A (2007) Flavonoid and chlorogenic acid profiles of English cider apples. Journal of the Science of Food and Agriculture 87: 719-728.
- Reyes-Izquierdo T, Shu C, Argumedo R, Nemzer B, Pietrzkowski Z (2014) The effect of ElevATP™ on whole blood ATP levels: A single dose, cross over clinical study. J Aging Res Clin Practice 3: 56-60.
- Hubbard R, Szlyk PC, Armstrong LE (1994) Solute model or cellular energy model? Practical and theoretical aspects of thirst during exercise, in fluid relpacement and heat stress national academy press: Washington DC 169-193.
- Wei M, Kampert JB, Barlow CE (1999) Relationship between low cardiorespiratory fitness and mortality in normal-weight, overweight, and obese men. JAMA 282: 1547-1553.
- Duvigneaud N, Matton L, Wijndaele K, Deriemaeker P, Lefevre J, et al. (2008) Relationship of obesity with physical activity, aerobic fitness and muscle strength in Flemish adults. The Journal of sports medicine and physical fitness 48: 201-210.
- Mahadevappa S, Naveen S, Anand T, Farhath K (2011) Effect of polyphenols in enhancing the swimming capacity of rats. Functional Foods in Health and Disease 1: 482-491.
- Malaguti MA, Hrelia CS (2013) Polyphenols in exercise performance and prevention of exercise-induced muscle damage. Oxid Med Cell Longev 2013: 825-928.
- Sureda ATS, Bibiloni M Del M, Tur JA, Pons A (2014) Polyphenols: Well beyond the antioxidant capacity: polyphenol supplementation and exercise-induced oxidative stress and inflammation. Curr Pharm Biotechnol 15: 373-379.
- DeFelice SL (1995) The nutraceutical revolution: Its impact on food industry R&D. Trends in Food Science & Technology 6: 59-61.
- Kalra EK (2003) Nutraceutical-Definition and introduction. Aaps Pharmsci 5: 27-28.
- Nasri H, Baradaran A, Shirzad H, Rafieian-Kopaei M (2015) New concepts in nutraceuticals as alternative for pharmaceuticals. International Journal of Preventive Medicine 5: 1487-1499.
- Pathak YV, Lokhande JN (2014) Handbook of Metallonutraceuticals: CRC Press.
- Scicchitano P, Cameli M, Maiello M, Modesti PA, Muiesan ML, et al. (2014) Nutraceuticals and dyslipidaemia: Beyond the common therapeutics. Journal of Functional Foods 6: 11-32.
Open Access Journals
- Aquaculture & Veterinary Science
- Chemistry & Chemical Sciences
- Clinical Sciences
- Engineering
- General Science
- Genetics & Molecular Biology
- Health Care & Nursing
- Immunology & Microbiology
- Materials Science
- Mathematics & Physics
- Medical Sciences
- Neurology & Psychiatry
- Oncology & Cancer Science
- Pharmaceutical Sciences
